Appearance
3D Visualization Module Guide
The 3D Visualization module provides an interactive Three.js-based viewer for exploring surface meshes generated from segmentation data. You can rotate, zoom, and pan the mesh, adjust per-class visibility and opacity, and explore internal structures using slice range controls.
For a conceptual overview, see 3D Visualization.
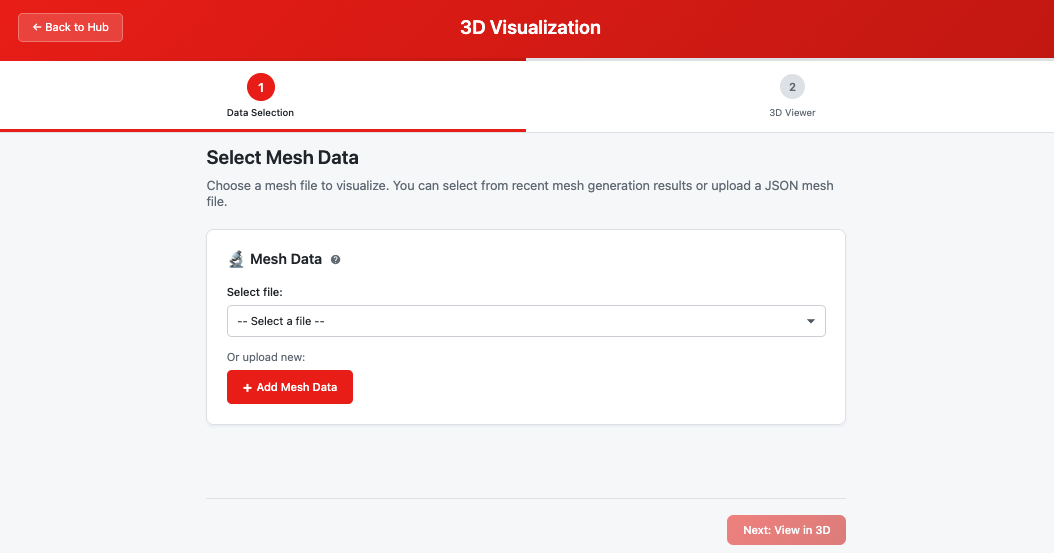 The 3D Visualization module displaying a multi-class mesh with per-class controls
Prerequisites
Before using this module, ensure you have:
- A mesh JSON file generated by the Mesh Generation module
- Or a compatible Three.js JSON mesh file uploaded to your workspace
Quick Start
- Launch module — Click "3D Visualization" from the workspace hub (or "Open in 3D Visualization" from Mesh results)
- Select mesh data — Choose a mesh JSON file from recent results or workspace
- Explore the mesh — Rotate with click-drag, zoom with scroll wheel
- Adjust display — Use class controls to toggle visibility and adjust opacity
Step-by-Step Guide
Step 1: Data Selection
Select the mesh data to visualize.
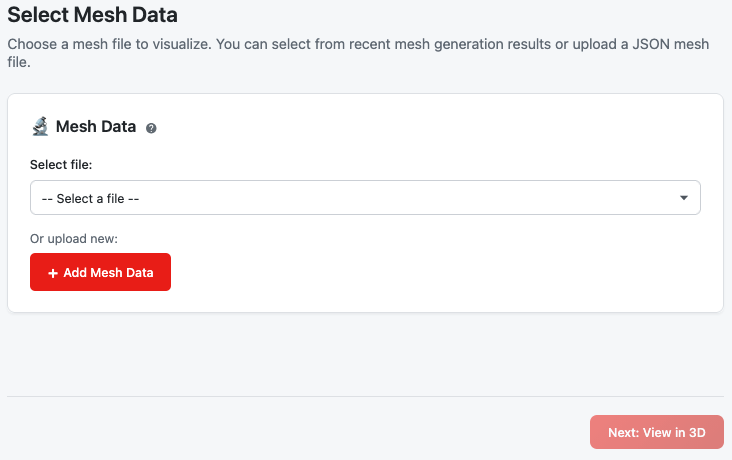 Step 1 data selection with mesh file options
Input Options
| Source | Description | When to Use |
|---|---|---|
| Recent Results | Mesh outputs from the Mesh Generation module | After generating a mesh |
| Workspace Files | Previously saved mesh JSON files | Revisiting earlier work |
| Upload | Custom mesh JSON files | External mesh data |
File Requirements
- Format: Three.js JSON mesh format (
.json) - Content: Must contain vertex positions, faces, and class information
- Source: Typically generated by the Mesh Generation module
Original Data Overlay
If the mesh was generated from a TIFF file in your workspace, the original imaging data can be overlaid on the 3D view. The module automatically detects this through data lineage tracking.
For more details, see Mesh Data Selection.
Click "Next: View in 3D" to proceed to Step 2.
Step 2: 3D Viewer
Explore your mesh interactively with full camera and display controls.
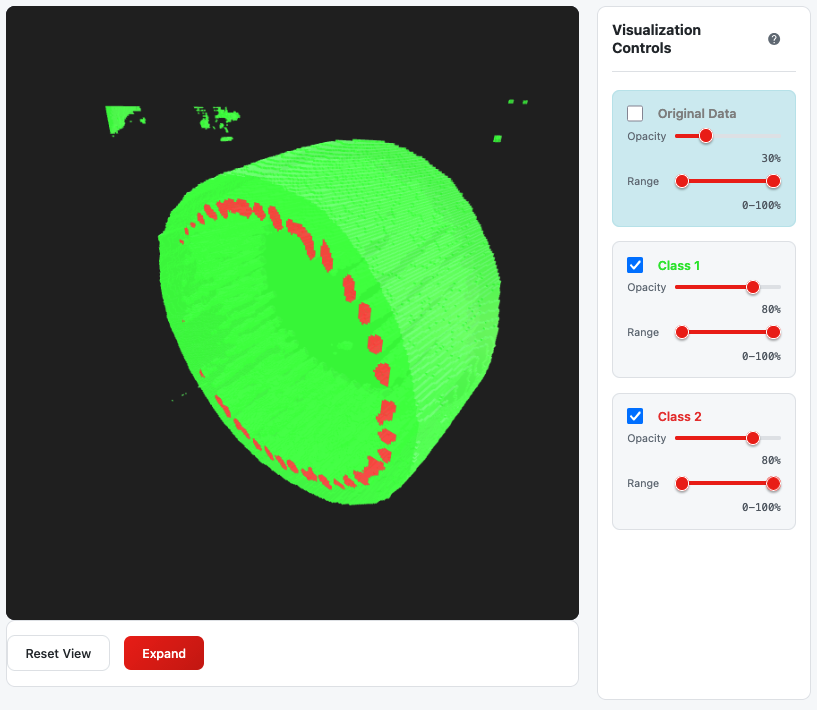 Interactive 3D viewer with canvas and controls panel
Interface Layout
| Area | Location | Purpose |
|---|---|---|
| 3D Canvas | Left/Center | Interactive mesh rendering |
| Controls Panel | Right side | Per-class visibility, opacity, and range controls |
| Toolbar | Bottom of canvas | Reset and expand buttons |
Camera Controls
Control how you view the mesh using mouse, keyboard, or touch.
Mouse Controls
| Action | How | Effect |
|---|---|---|
| Rotate | Left-click + drag | Rotates mesh around X/Y axes |
| Pan | Ctrl + drag (or Cmd + drag on Mac) | Moves mesh in screen space |
| Zoom | Mouse wheel scroll | Zooms camera in/out |
| Reset | Double-click | Resets view to default |
Keyboard Controls
| Key | Effect |
|---|---|
| Arrow keys | Rotate mesh (left/right = yaw, up/down = pitch) |
| Ctrl + Arrow keys | Pan mesh in screen space |
| R | Reset rotation and position |
| Esc | Exit expanded/fullscreen mode |
Touch Controls (Tablet/Mobile)
| Gesture | Effect |
|---|---|
| Single finger drag | Rotate mesh |
| Two-finger pinch | Zoom in/out |
| Two-finger drag | Pan mesh |
Tip: Double-click anywhere on the canvas to quickly reset the view to its default position and rotation.
Class Controls
Each segmented class has its own control panel for customizing its appearance.
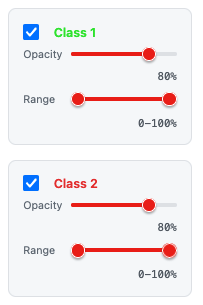 Per-class controls for visibility, opacity, and slice range
Visibility Toggle
- Checkbox next to class name
- Check to show the class mesh
- Uncheck to hide it
- Useful when classes overlap and obscure each other
Opacity Slider
| Setting | Range | Default |
|---|---|---|
| Opacity | 10% – 100% | 80% |
- Drag the slider to adjust transparency
- Lower opacity reveals structures behind the surface
- The visual fill shows current opacity level
Slice Range (for slice-based meshes only)
Some meshes support slice range selection to reveal internal structures:
| Control | Purpose |
|---|---|
| Left handle | Set minimum visible slice |
| Right handle | Set maximum visible slice |
| Range indicator | Shows percentage of slices visible |
Note: Slice range controls only appear for meshes generated with the VoxelSlices format. Standard surface meshes show only visibility and opacity.
For more details, see Visualization Controls.
Original Data Overlay
If your mesh was generated from a TIFF in your workspace, you can overlay the original imaging data.
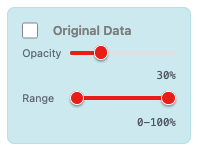 Original imaging data overlay with opacity and range controls
| Control | Purpose |
|---|---|
| Visibility | Toggle original data planes on/off |
| Opacity | Adjust transparency (5% – 100%, default 30%) |
| Slice Range | Show specific depth regions |
The original data displays as textured planes that rotate with the mesh, providing anatomical context for the segmentation.
Toolbar Buttons
Located at the bottom of the 3D canvas:
| Button | Action |
|---|---|
| Reset View | Clears all rotations, pans, and resets controls to defaults |
| Expand | Enters fullscreen mode for larger viewing area |
In expanded mode:
- The canvas fills the entire viewport
- Controls panel floats in the top-right corner
- Click "Collapse" or press Esc to exit
Mouse and Keyboard Reference
| Input | Action |
|---|---|
| Left-drag | Rotate mesh |
| Ctrl + drag | Pan mesh |
| Scroll wheel | Zoom in/out |
| Double-click | Reset view |
| Arrow keys | Rotate mesh |
| Ctrl + arrows | Pan mesh |
| R | Reset rotation and position |
| Esc | Exit expanded mode |
Troubleshooting
| Issue | Cause | Solution |
|---|---|---|
| Black screen / no mesh | WebGL not supported or mesh failed to load | Check browser WebGL support; try refreshing |
| Mesh appears very small | Auto-scaling issue | Use scroll wheel to zoom in |
| Can't see a class | Visibility toggled off or fully transparent | Check visibility checkbox and opacity slider |
| Controls not responding | Focus may be on input field | Click on the canvas to restore focus |
| Slice range not available | Mesh format doesn't support slicing | Only VoxelSlices format meshes have range controls |
| Original data not showing | Source TIFF not found via lineage | Regenerate mesh from a workspace file |
Related Help Articles
Module Overview:
- 3D Visualization — Module introduction and features
Step-by-Step:
- Mesh Data Selection — Input requirements and data sources
- Visualization Controls — Class controls, camera, and display options