
Appearance
The Noise Model
A parametric spectral model of EM noise — anisotropic spectrum, banding, and axial correlation — fitted to background crops of the real stack.
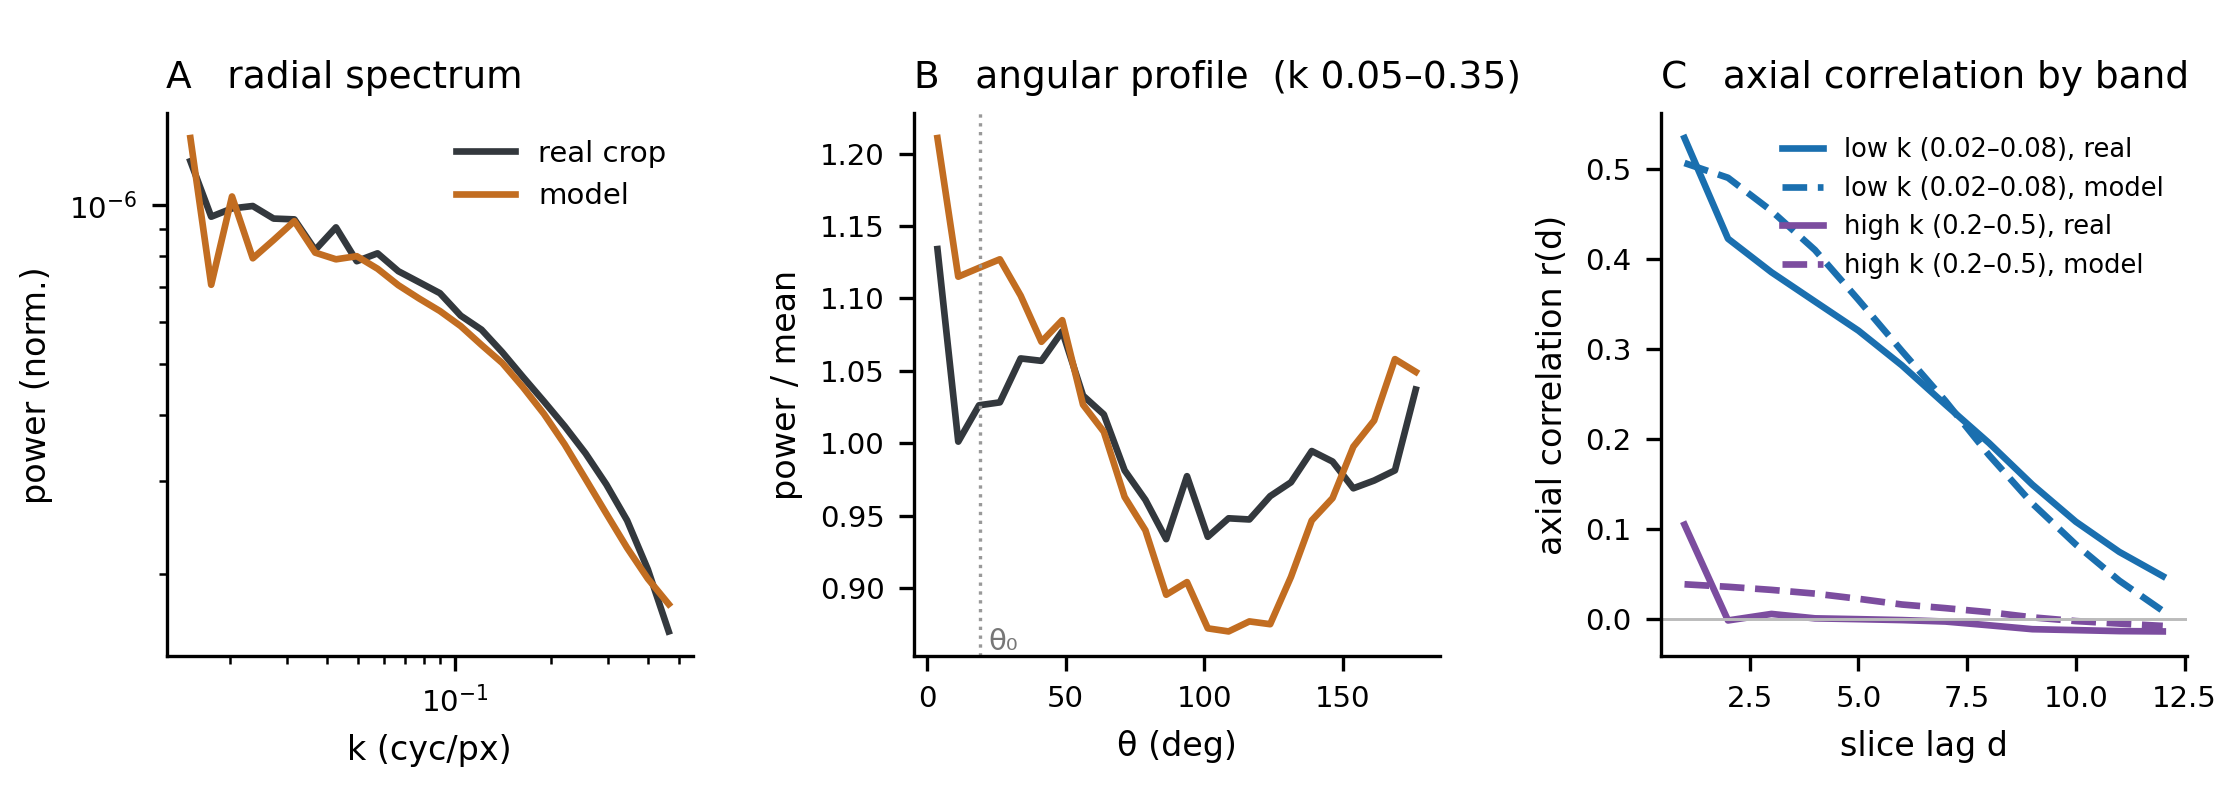 The components of real EM noise the model captures: colored anisotropic spectrum, banding, and between-slice correlation
The Declared Power Spectrum
The in-plane noise field is drawn from a declared power spectrum
P(k, θ) = [1 + B·|cos(θ − θ₀)|^(2p)] · k^a · exp(−(k/k_c)^b) + white| Parameter | Role |
|---|---|
a | Spectral slope — the noise "color" |
k_c, b | Cutoff frequency and rolloff shape |
B, theta, p | Anisotropy: strength, orientation, angular sharpness |
white | White (flat) floor |
sd | Required — the noise amplitude in the tomogram's own grey units |
Banding
A separate banding term (band_amp, band_ax, band_lz, band_axis) captures the stripe-like component common in tomograms. It is fitted closed-form (not search-based) by fit_banding.py — closing the 30–70% under-reproduction of real banding that the spectrum-only fit leaves behind.
Axial Correlation
Real stacks correlate between slices (measured adjacent-slice r of 0.15–0.95 across the development volumes). The zc block (zc_amp, zc_lz, plus the short-range zc2_* terms of the v4 model) makes the rendered noise planes correlate along z:
r(d) = zc_amp² · exp(−d² / (4·zc_lz²))This term is load-bearing: the reduced "v1" model without it is rejected by the validation protocol in 27/30 cells — axial correlation is not a nicety but a property denoisers respond to.
The Contamination-Tolerant Fit
noise_fit.py fits {spectrum, banding, axial} from a background-crop stack using a difference-spectrum estimator that tolerates residual structure in the crop. Two budgets:
| Budget | Settings | Time |
|---|---|---|
| Fast (workbench) | 6 starts / maxiter 500 | ~2–3 min |
| Production | maxiter 1200 | ~12–19 min |
The result is cached as a <crop>.noisefit.json sidecar next to the crop — instant on re-open; delete the sidecar to refit. A production-fit JSON always wins over the workbench fit.
C1: Is the Crop Clean Enough?
Fitting from a contaminated crop poisons everything downstream, so the fitter runs the C1 cleanliness checks: static z-mean excess against the fitted model, and skew/kurtosis of the marginal. The purity study behind these checks separates clean from contaminated noise sources at p < 10⁻⁵. The workbench surfaces the verdict as the C1 badge.
The Noise File
Either shape is accepted (one model per file):
jsonc
// nested
{ "params": { "a": -0.5, "kc": 0.34, "b": 2.8, "B": 0.35, "theta": 15.3, "p": 1.04, "white": 1.18 },
  "band":   { "band_amp": 0.1, "band_ax": -1.0, "band_lz": 6.0, "band_axis": "y" },
  "zc":     { "zc_amp": 0.9, "zc_lz": 1.4 },
  "sd": 1.54 }

// or flat: parameters + sd at the top level; band_* / zc_* optional
zc_amp and zc_lz are scale-free, so they transfer across grey scales. Absent terms default to zero.
Related
- Tuner Workbench — fitting from a crop in the UI
- The Validation Protocol — how the model's realism is tested